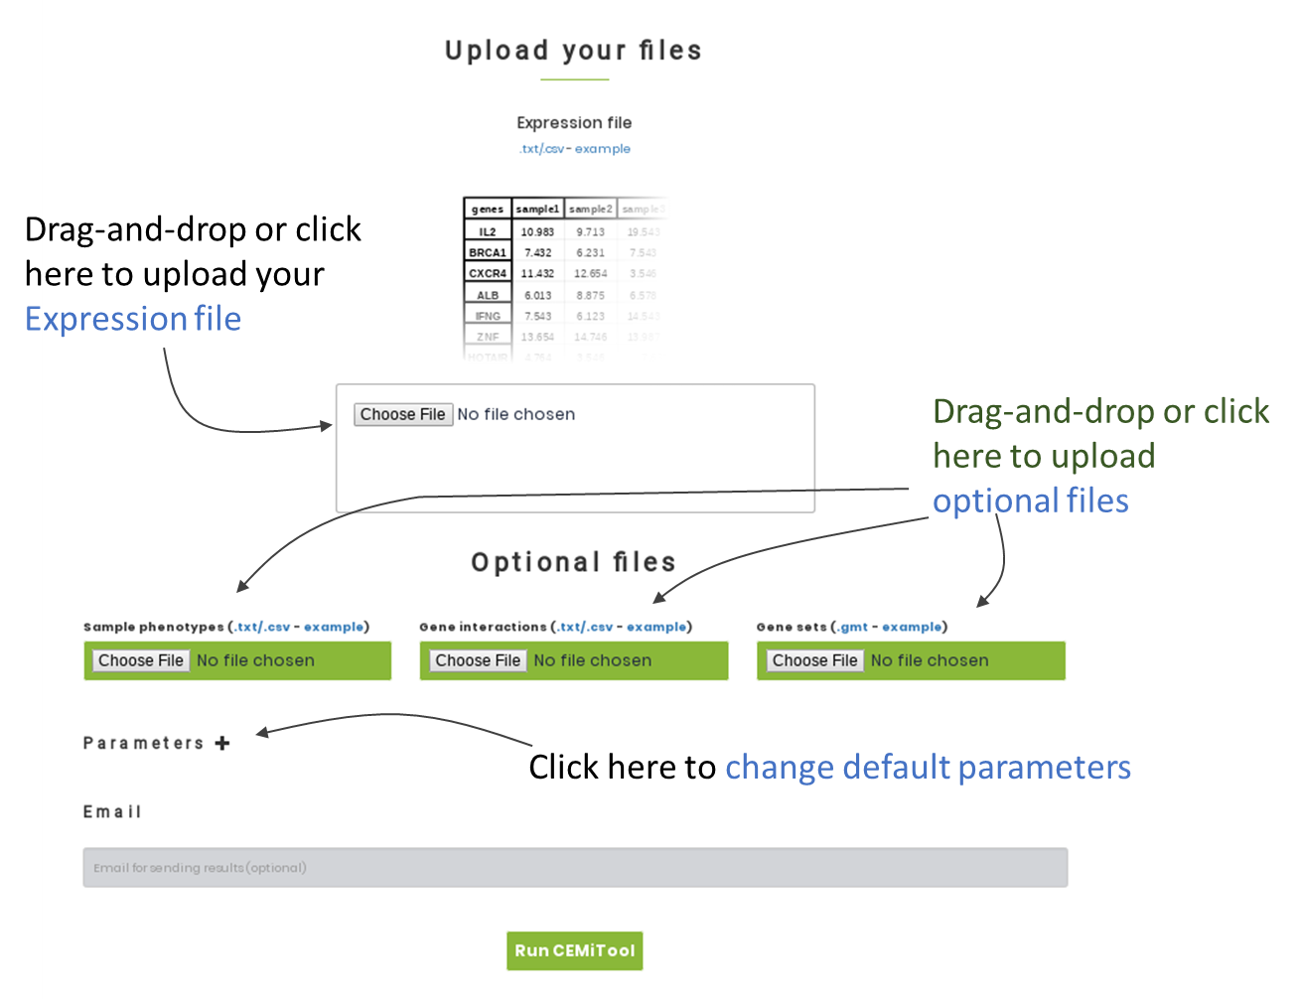
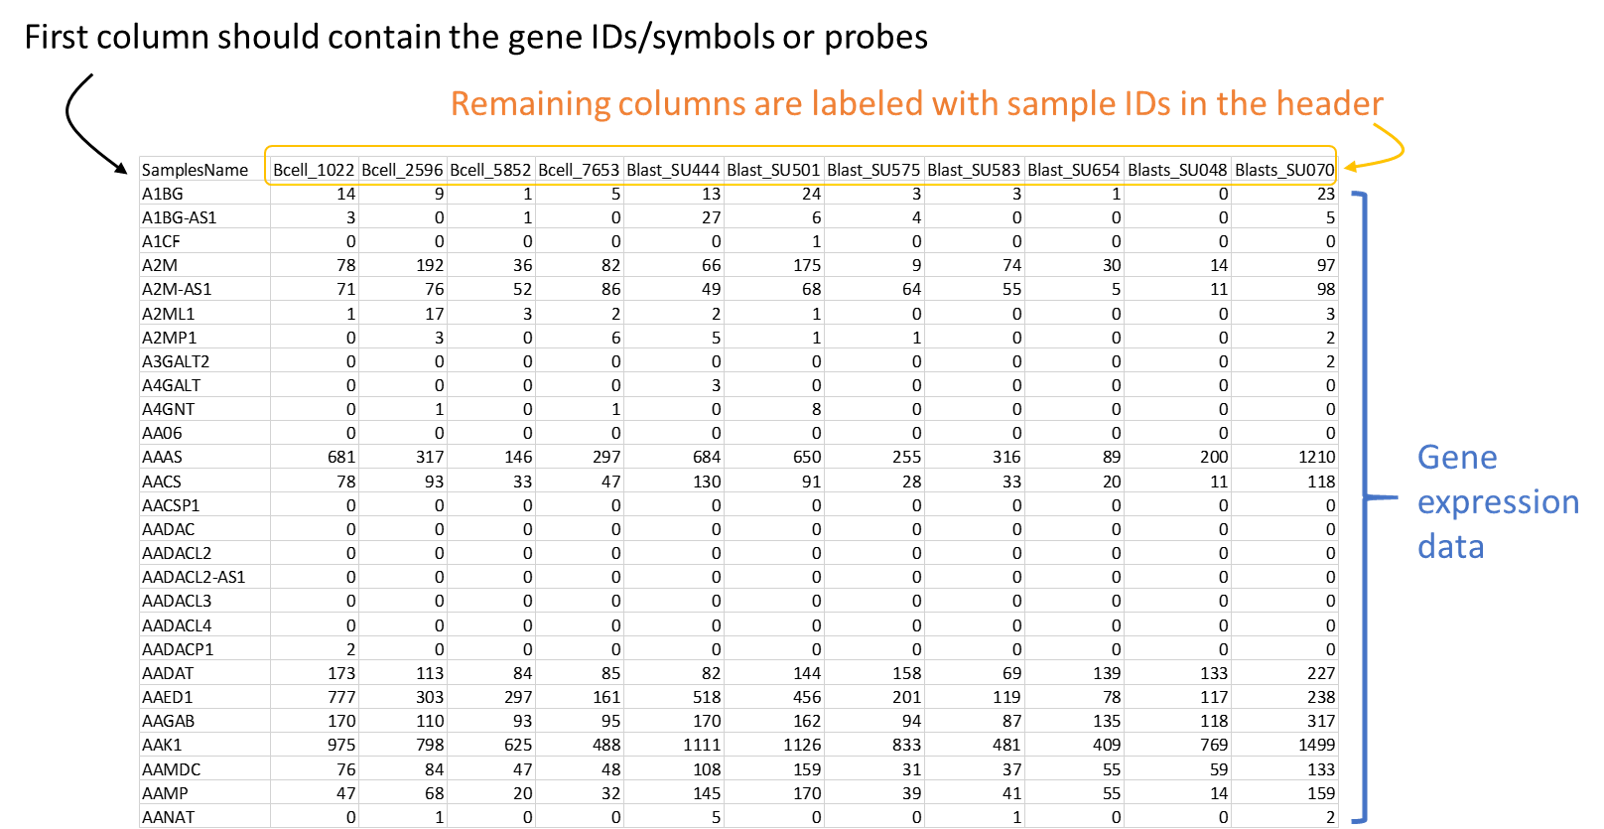
To identify the co-expression modules, you only need to upload a tab-delimited .txt file o comma-separated values .csv file (the "Expression file"), which contains the normalized levels of genes, proteins or metabolites in a set of biological samples. See expression file format and example.
Example expression file is derived from a RNA-seq experiment on different types of immune cells. The original publication is found here. For running CEMiTool using this example expression file, please check the box "Apply VST" in "Parameters" section.
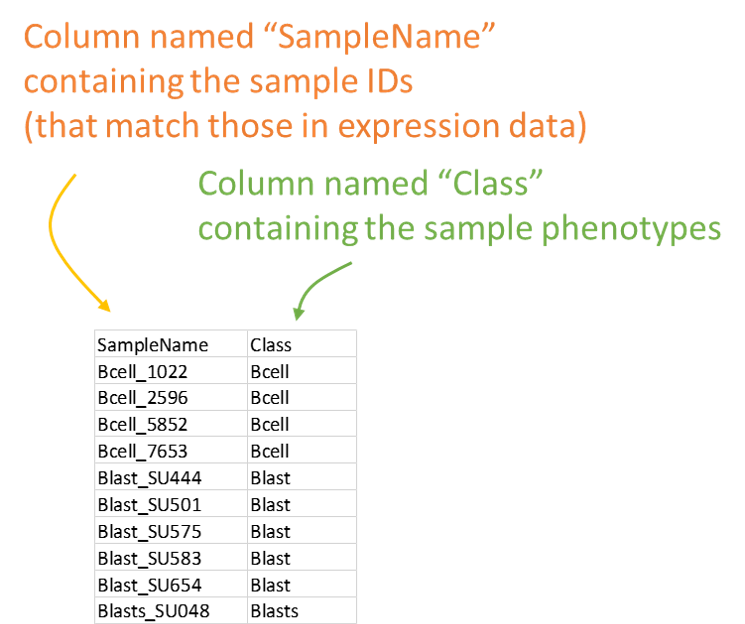
To generate the colored profile plots and perform the module activity analysis, you will also have to provide a tab-delimited .txt file or a comma-separated values .csv file (the "Sample phenotypes") containing the class labels of each sample in your expression file. See sample phenotypes and example
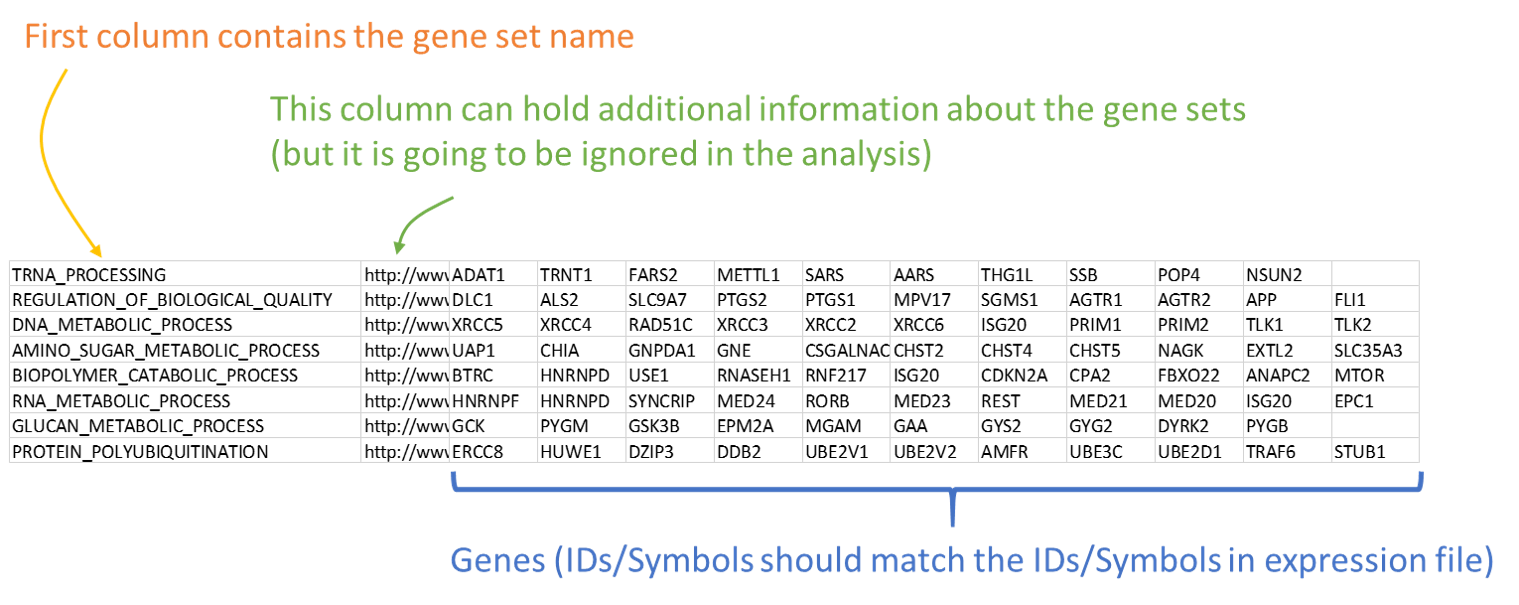
To perform the functional enrichment analysis, CEMiTool requires an additional file in GMT format (the "gene sets") that contains the list of genes that are functionally related (i.e. pathways, list of miRNA-target genes, etc). See gene sets file format and example.
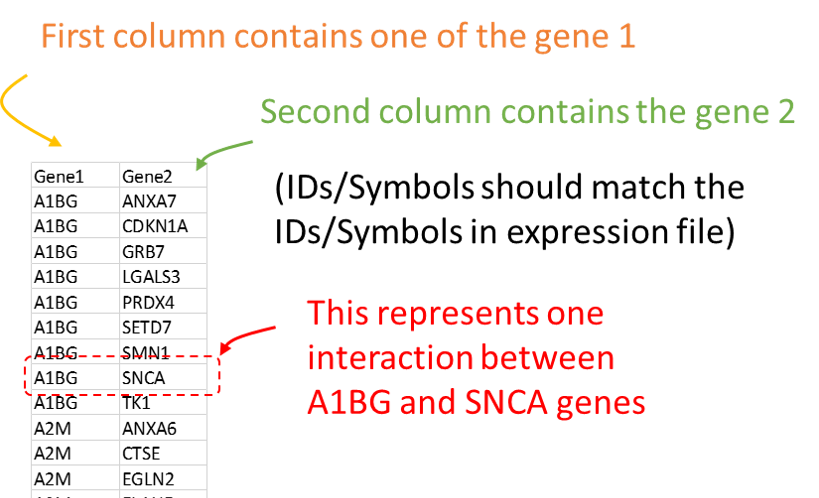
Users can also integrate your results with interactome data to generate interaction networks. For this, you will have to provide a tab-delimited .txt file or a comma-separated values .csv (the "gene interactions") that contains the interactions (i.e. protein-protein interaction data, transcription factors and their transcribed genes, metabolic pathways, etc). See gene interactions file format and example .
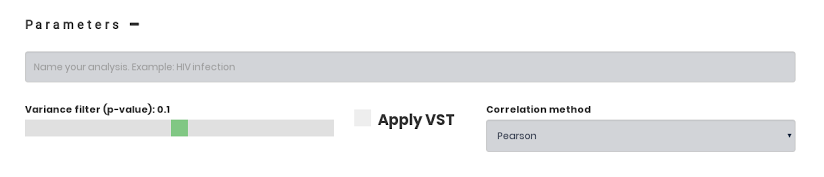
In case you prefer to run CEMiTool with non-default parameters, you are free to change them. Just click on the plus sign (+) next to "Parameters". The parameters are fully described here.
Analysis: The name of the analysis will appear on the top of the results page.
Variance filter (p-value): Prior to identifying co-expression modules, this filter selects most variant genes. The higher the p-value cutoff, more the are used as input for CEMiTool.
Apply VST: RNA-seq data normalizations sometimes require a correction of the mean-variance dependency. This parameter models the expression data as a negative binomial distribution, and then performs the adequate Variance Stabilizing Transformation.
Correlation method: Users can choose between Pearson or Spearman as a correlation method to identify the modules.
Email: Users can receive a notification by e-mail when the analysis is done. A link with the results is provided in the e-mail.
The section below provides a very short summary of the analysis. To access the full report, please click in “Download full report” to download the file “cemitool_results.zip”, which contains several tab-delimited text .tsv files and 1 html report (see details below).
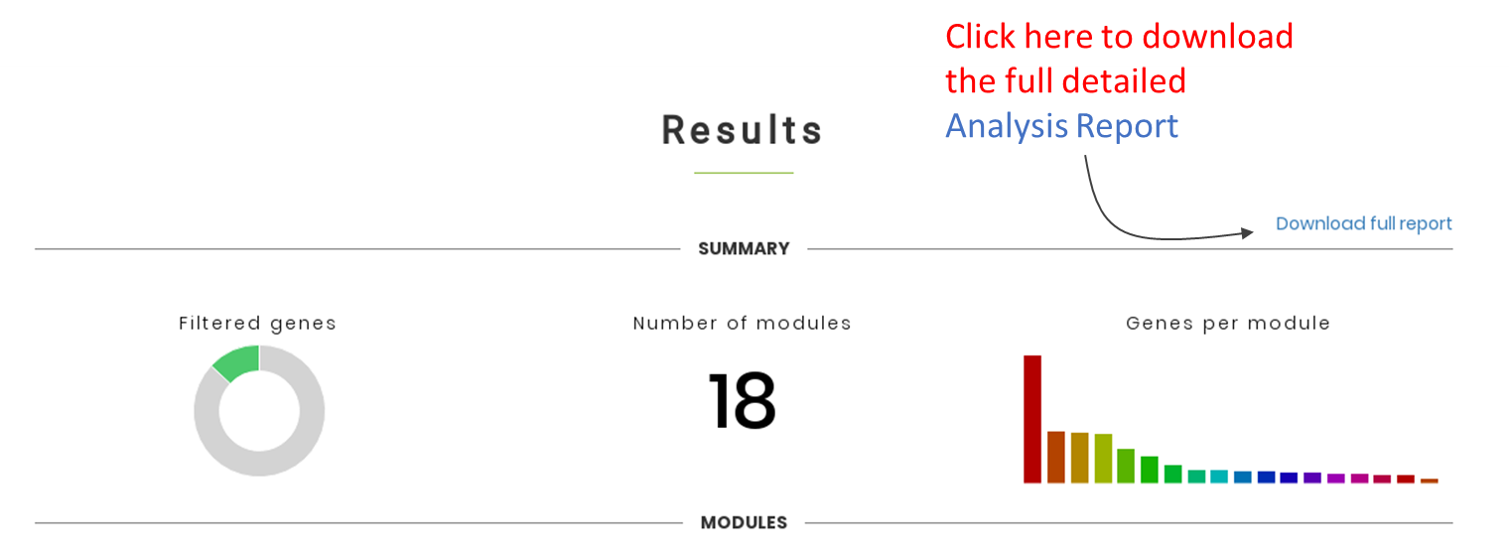
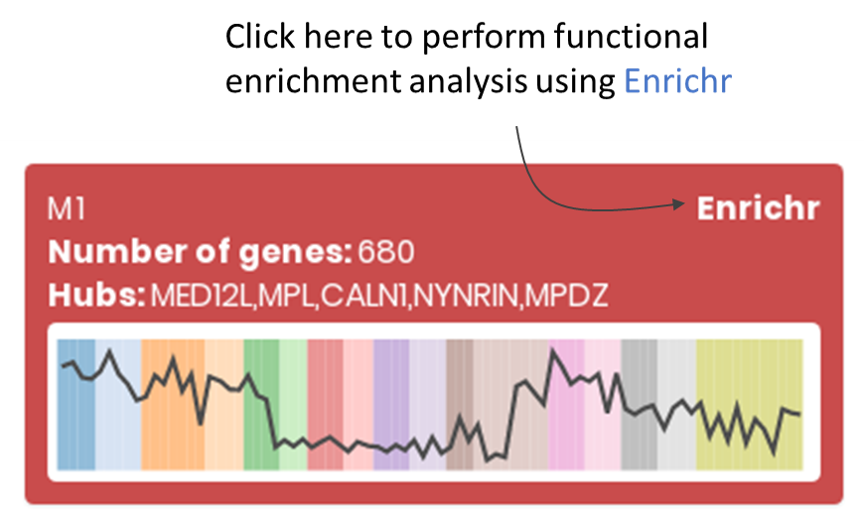
Section "Modules" contains information about modules in terms of genes, major hubs and the median activity of genes within the modules across samples from different biological conditions (shown in distinct colors).
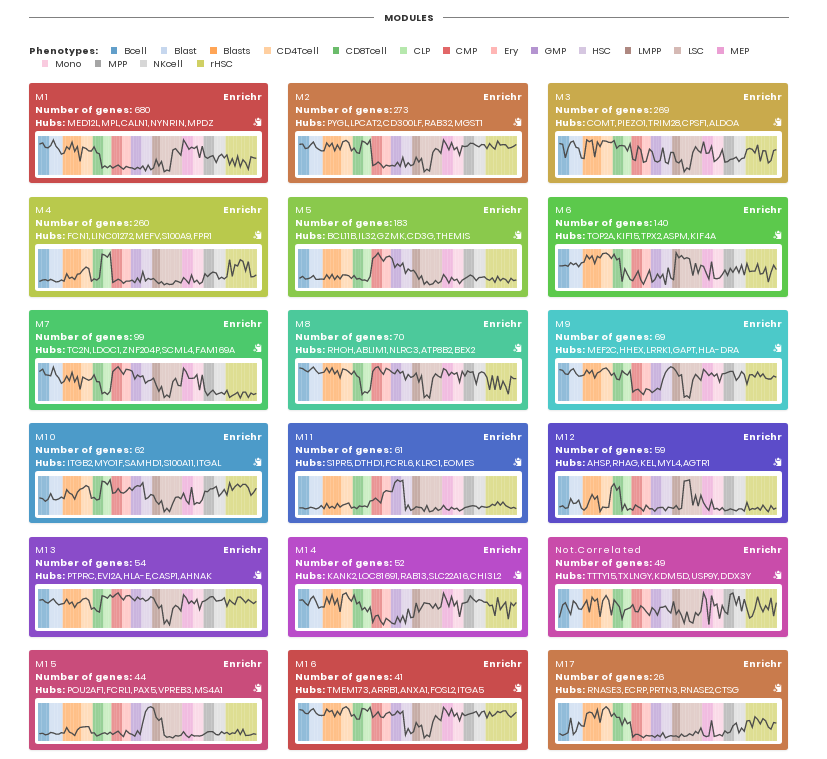
For each module, users can perform a functional enrichment analysis using Enrichr.
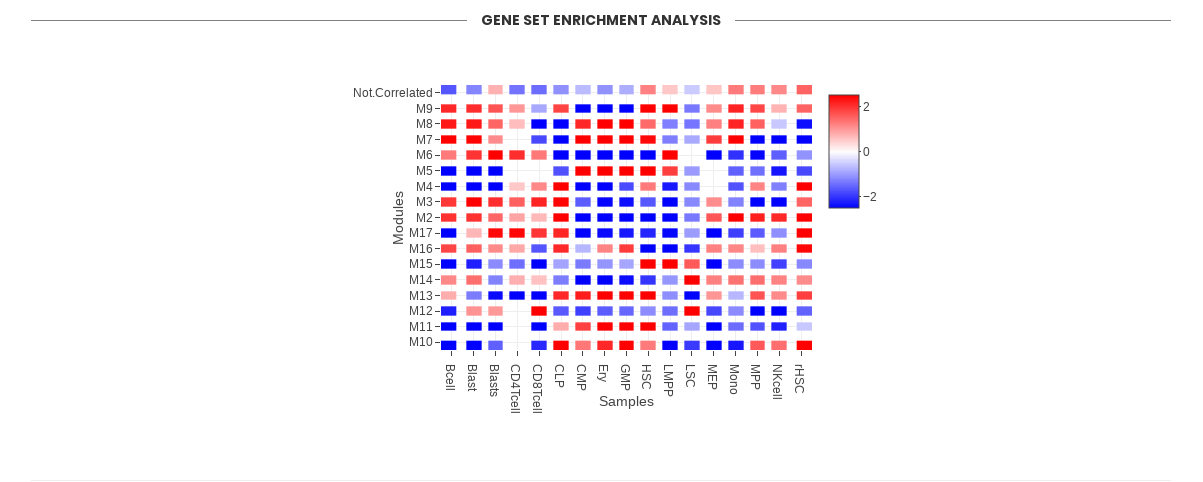
Section “Gene Set Enrichment Analysis” shows the activity of modules in the sample phenotypes provided by the user. The figure displays the Normalized Enrichment Score (NES) of modules (red represents higher activity and blue represents lower activity). GSEA is run using the genes within a module as gene set and the median z-score values of each phenotype as rank. For each NES, a Benjamini-Hochberg adjusted p-value is calculated, reflecting the statistical significance of the test.
After extracting the contents of cemitool_results.zip file, users will find a “report.html” that can be opened in a web browser. There, users will see 6 tabs of results. In case you did not provide all optional input files, some of these tabs will be empty. Here we describe the results displayed on each tab.
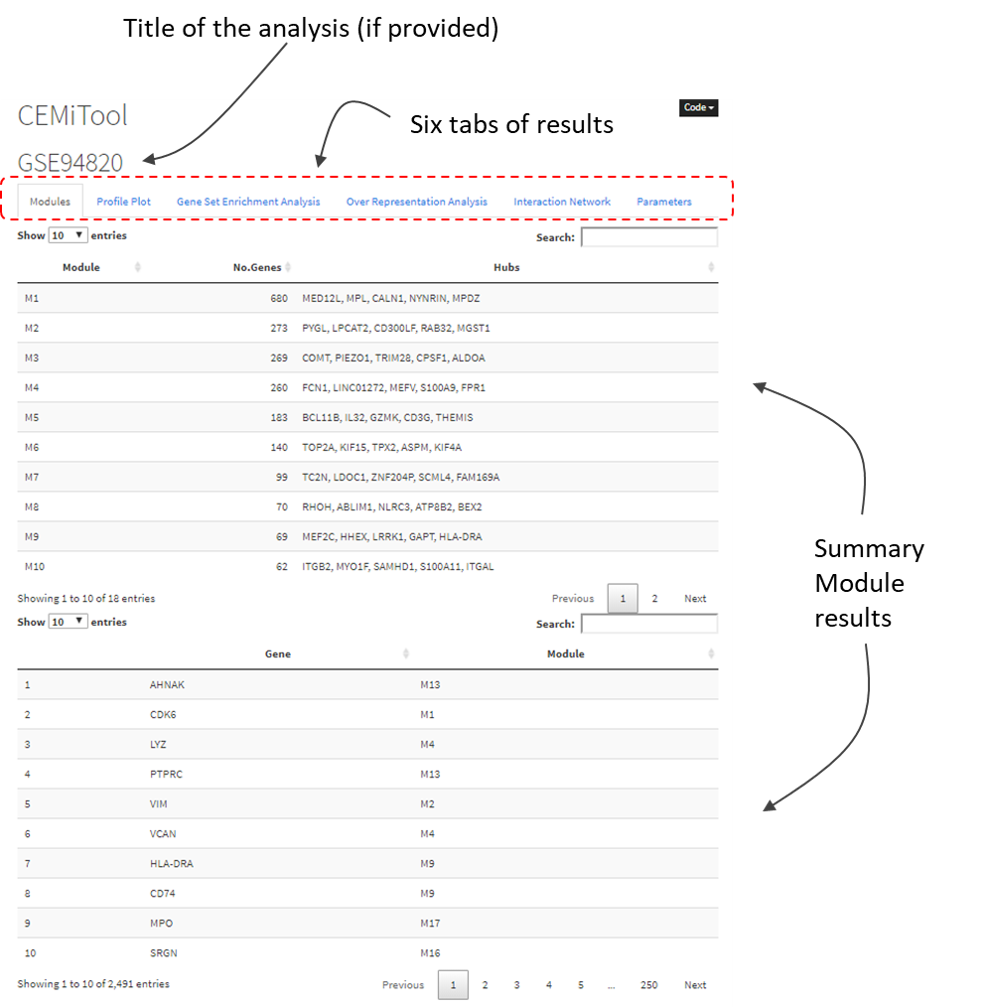
The tab shows the number of modules identified by CEMiTool, and the number of genes and hubs found on each module. Users can also search for genes (and its corresponding module) in the "Search" field.
The tab shows the individual expression levels of each gene within modules. The colors represent the different sample classes. The black thick line represents the median expression of all genes within the module. The name of the samples is displayed in x-axis and ordered according to sample annotation file. The colors of lines are specific for each module and automatically assigned by CEMiTool.
CEMiTool assesses the module expression activity by using a Gene Set Enrichment Analysis (GSEA) for each sample class. First, CEMiTool performs a z-score gene normalization on all input genes (prior to gene variance and expression filters) and calculate the mean for each sample class. Then, a pre-ranked GSEA approach (using default parameters) is applied independently for each class. Red and blue represent, respectively, higher and lower module activity. The circle and color intensity are proportional to the Normalized Enrichment Score (NES) values.
The bar graphs display the association between genes within a module and the genes from user-provided gene sets. Only the top 10 gene sets are shown for each module. The colors of the bars are specific for each module and automatically assigned by CEMiTool. The color intensity is proportional to the adjusted p-value. Additional information about the analysis is displayed on the bottom part.
CEMiTool integrates the co-expression results with user-provided interactome data. The top ten most connected genes (hubs) are labled and colored based on their "origin": if originally present in the CEMiTool modules, they are colored blue; if inserted from interactions file, they are colored red. The size of the node is proportional to its degree.
Users can check all the parameters utilized in the analysis. This is useful when writing the paper.
A tab-delimited text table of expression data that contains an initial column with unique gene ID or symbol, and other columns that contain gene expression data and sample names in the header. An example of single-cell RNA-seq data can be downloaded here
You can save your excel file as a tab-delimited .txt file. See here.
A table with at least two columns named "SampleName" and "Class", which contain the sample names (matching with your Expression) and class information. Additional columns can be provided containing phenotypic information but they are going to be ignored in the analysis. Download example here.
You can save your excel file as a tab-delimited .txt file. See here.
This is a .gmt format file that contains gene set information. This format is also a tab-delimited text table but with the extension .gmt. The gene sets are arranged across the rows. The first column contains the pathway name, the second column contains a shorter description or a dummy field ("NA"), and the remainder of each row contains the gene symbols in that pathway. Rows can have unequal length. Example GMT file can be downloaded from here.
See additional information here about the .gmt file format. A large collection of files in GMT format can be obtained here.
This is tab-delimited text table that contains interaction information. Although it generally represents protein-protein interactions, the file can represent any kind of gene/protein/metabolite interaction. Interactions between gene 1 (first column) and gene 2 (second column) are shown across the rows. All additional columns will be ignored. See example file here.
See additional information here about the Protein-protein interactions. A large collection of protein-protein interaction files can be obtained here or here .
The beta value is a parameter that lies in the core of the weighted gene co-expression network analysis (WGCNA). Originally, this parameter needed to be defined by the user. Therefore, the original CEMiTool R package implemented an automatic beta value selection procedure that uses the gene expression data to select the best value on behalf of the user. In some cases, however, the CEMiTool automatic procedure fails to find the best solution and cannot keep on with the co-expression analysis and this error is raised.